This three-minute video demonstrates how engineers can use the new shmoo plot, intensity chart and 3D plot functions in Cilab’s ci230 NFC testing suite to quickly visualize the RF fields of devices under test.
 “The addition of the feature to Cilab’s ci230 test suite allows development engineers to get deep insight into a terminal’s RF performance, geometrically mapped to the device under test,” Cilab CEO Alfred Binder told NFCW.
“The device’s RF field is made visible in high resolution graphs that are based on more than 25,000 measurements. In 10 minutes, you get a very good overview of what the RF field looks like, including parameters such as power transfer and receive sensitivity.”
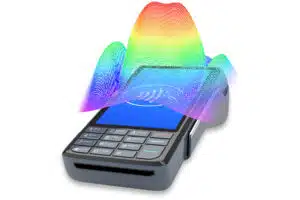
“Shmoo plots let engineers working on the development of a new contactless payments terminal quickly and easily identify any ‘dead spots’ in the RF field generated by the antenna in their device,” Binder explained.
“This is really important for devices either not passing certification tests in the lab or causing interoperability issues in the field because of problems with the RF field.
“Without a shmoo plot, intensity chart and 3D plot images, it is really a matter of guesswork to understand what the RF field looks like.”
This video has been produced and sponsored by Cilab.
How to watch this video
This 3m13s video is available to watch free of charge to NFCW Knowledge Centre members.
This resource is available free of charge to NFCW Knowledge Centre members. Log in or join for free to get immediate access.
Explore more...
Topics
Companies
This item is part of NFCW.